For larger distributed server solutions, we recommend using Elasticsearch.
Firstly you will need to Create an Elasticsearch Data Source.
To configure Execution Logging to use an Elasticsearch Data Source:
- Click the Settings icon

- Select Logging from the sub menu in the centre of the Settings Tab that opens.
This will open the Logging settings. - Click on the Logging Data Source dropdown and click on the Elasticsearch Data Source created previously.
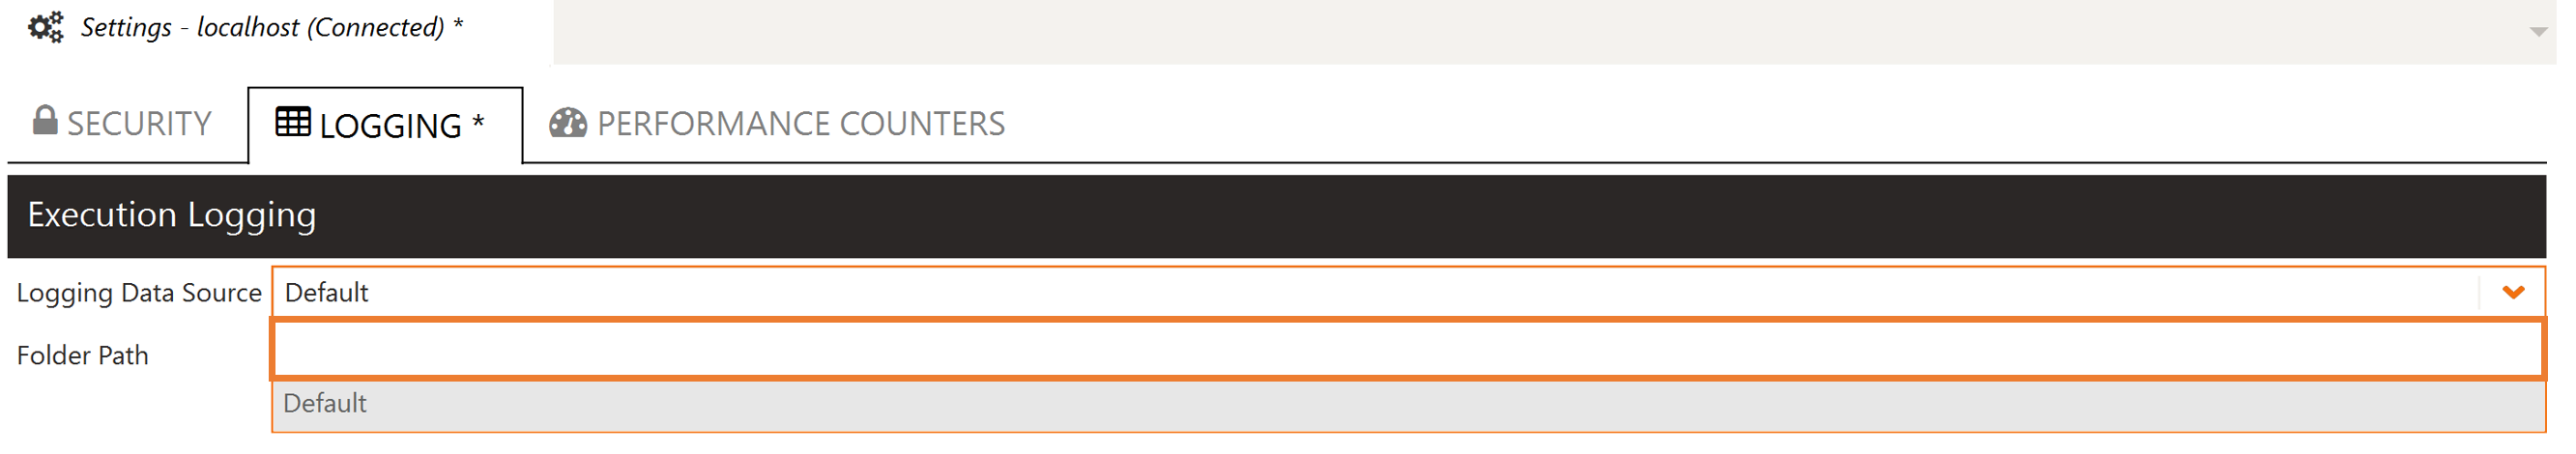
- The Folder Path is now removed as seen below.
You will see a checkbox for Encrypt. It defaults to checked. This will encrypt the data source payload in the auditing settings file. If unchecked this will not be encrypted.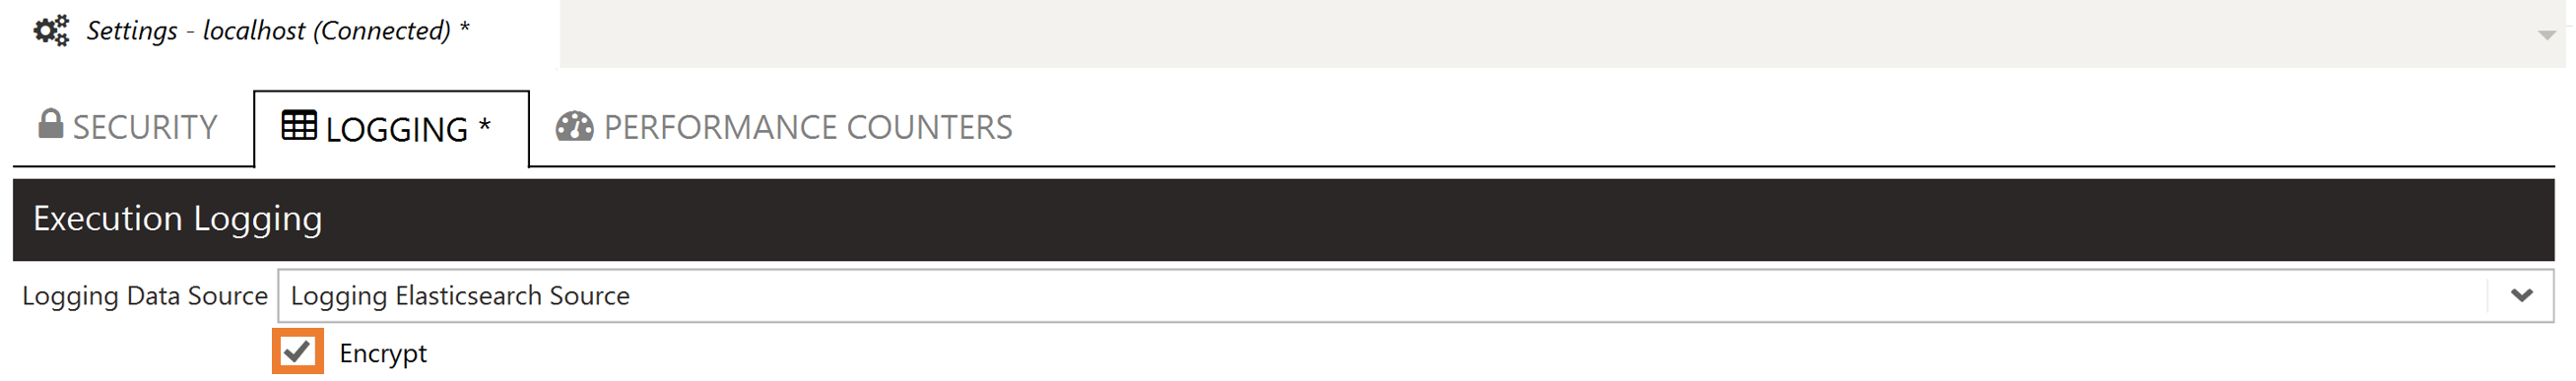
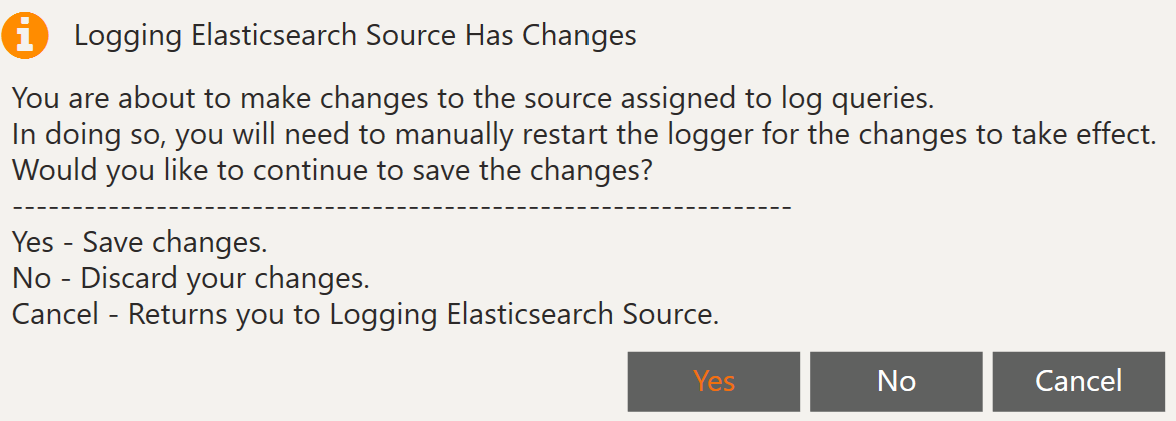
- Click Save. There will a Pop-Up warning that for the changes to take effect, the Warewolf Logger will need to be restarted.

- Click Yes.
- Restart the Warewolf Logger.
This can be done by opening the Task Manager and clicking on the Details tab.
Find the WarewolfLogger.exe.
Right click and then click End Task.
Within a few seconds you will see the WarewolfLogger.exe restart.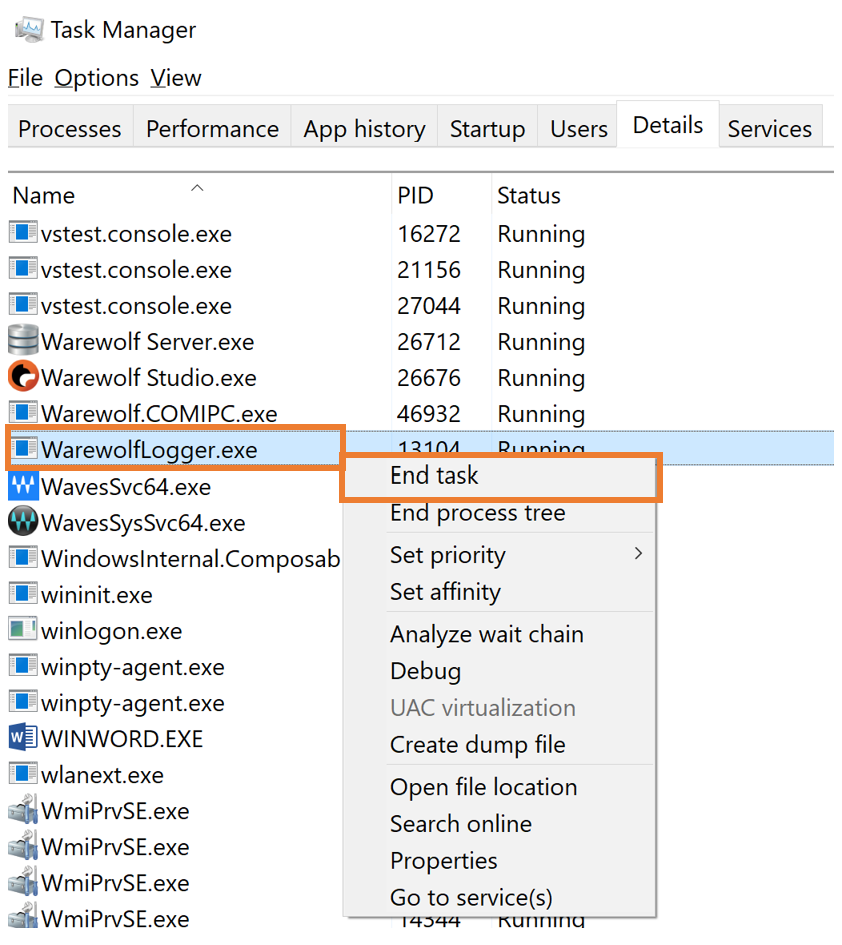
Useful Links
Chrome ElasticSearch Head Plugin to view logs
Install Elasticsearch with Docker